Monitoring
Everything on this page is in the console, and works the same on one server or a cluster. The webmail's Administration has a smaller dashboard of its own, described in Administration.
History
A new install keeps two kinds of history, both in its own data store:
| Setting | Holds | Needed by |
|---|---|---|
| Settings › Storage › Metrics | Samples of the server's numbers over time | The dashboards' charts, alerts, and the webmail's history cards |
| Settings › Storage › Tracing | A record of each delivery, in and out | Emails › History |
Both start as Use data store. Point either at a separate PostgreSQL, MySQL or FoundationDB store to keep history apart from mail, or set it to not store anything to turn that history off. How long each is kept is under Settings › Storage › Retention › Telemetry:
| Field | Default |
|---|---|
| Tracing History | 14 days on a server installed with 2026.9.28.4 or later; 30 days before |
| Metrics History | 90 days |
| Metrics Collection | Every hour, on the hour |
The dashboards
Management › Dashboard opens on the command center. Beside it, under Trends, are Network, Security, Delivery, Performance and Storage, and Cluster when the server is one node of several.
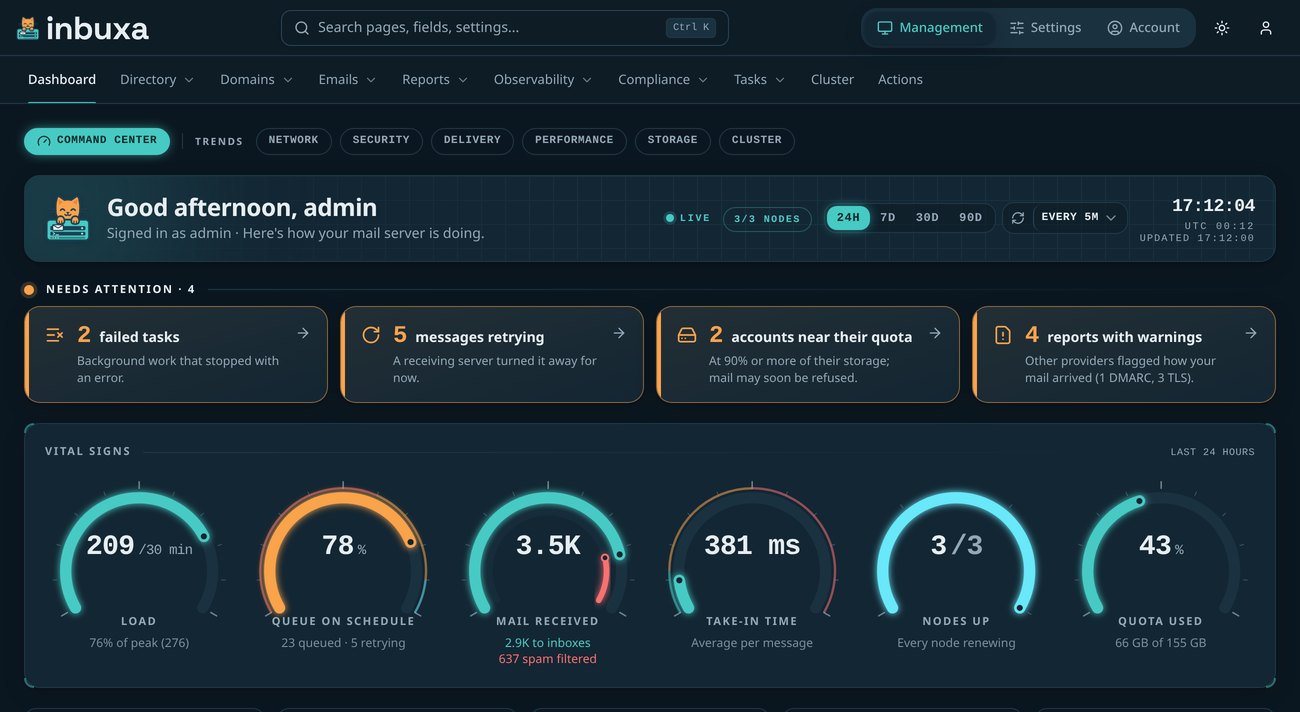
Every dashboard page shares the band across the top, and it stays put as you move between them:
- Live lights while the console is receiving the server's live numbers. On a cluster, a chip says how many nodes are up (3/3 nodes) and opens the Cluster page. Legacy off shows while IMAP, POP3 and ManageSieve are all switched off.
- 24H, 7D, 30D and 90D pick the period every panel reads.
- The refresh button, and how often the page refreshes by itself: off, or every 1, 5, 10 or 15 minutes, 5 unless you change it. A refresh keeps the last numbers on screen until the new ones arrive. The period and refresh choices are remembered.
- A clock, with UTC below it and when the numbers last came in.
Needs attention
Below the band, a tile for each thing that needs a look, most serious first. Each opens where you'd deal with it:
| Tile | Opens |
|---|---|
| Critical security items not yet accepted | The security to-do list |
| Nodes not responding | The Cluster page |
| Recipients given up on | Emails › Queued |
| Failed tasks | Tasks › Failed |
| Messages retrying | Emails › Queued |
| Accounts at 90% or more of their quota | Directory › Accounts |
| Stages running slow | The Performance page |
| DMARC and TLS reports with warnings | The reports they came in |
| Live feed unavailable | Nothing: the counts still come from the server's records, but the connection meters go dark |
The first three are critical, and the rest are warnings. A tile about something your role can't open isn't shown. When all is well, there are no tiles and no heading.
The command center
- Vital signs: dials for Load (messages handled against the period's peak), Queue on schedule (queued and retrying), Mail received (to inboxes against spam filtered), Take-in time (the average per message), Nodes up on a cluster, and Quota used when accounts have quotas.
- A row of figures for the period: people, domains, mail received and sent, queued, spam blocked, failed sign-ins, addresses banned, mail stored, and this node's memory.
- Live connection meters, and response times for each stage, marked fine, fair or slow.
- Mail flow in and out over the period, when people connect and when sign-ins fail by hour and day, where mail is waiting, and who uses the space.
Trends
Each trend page has its own dials over the period, figures and charts: the connections and sessions on Network, what got stopped and why on Security, deliveries and their errors on Delivery, each stage's response times on Performance, and space on Storage.
On a cluster, Cluster shows how many nodes are up, the oldest heartbeat, how much of the period the links between nodes and the data layer ran clean, a live list of nodes, and error trends. See Clustering.
Following a message
- Management › Emails › Queued: messages waiting to be delivered, with each recipient's status. A recipient that failed can be explained when local AI is set up.
- Management › Emails › History: Inbound Delivery and Outbound Delivery, a record of each delivery with every step it went through. Needs the tracing store.
- Management › Emails › Delivery tests: tries delivery to an address and shows each step as it happens: the MX lookup, the connection, TLS, the MTA-STS and DANE checks, and each SMTP reply up to the recipient being accepted. It stops there and sends nothing. The quickest way to see why mail to one domain doesn't arrive.
Tasks
Management › Tasks › Scheduled lists background jobs waiting to run, and Failed those that gave up, with why.
Live tracing and logs
- Management › Observability › Live Tracing streams the server's events as they happen, filtered to what you're looking for.
- Management › Observability › Logs shows the server's log. It reads the
file written by a Log file tracer. A new install has one, writing
inbuxa.login/var/log/inbuxa, rotated daily.
How long log files are kept
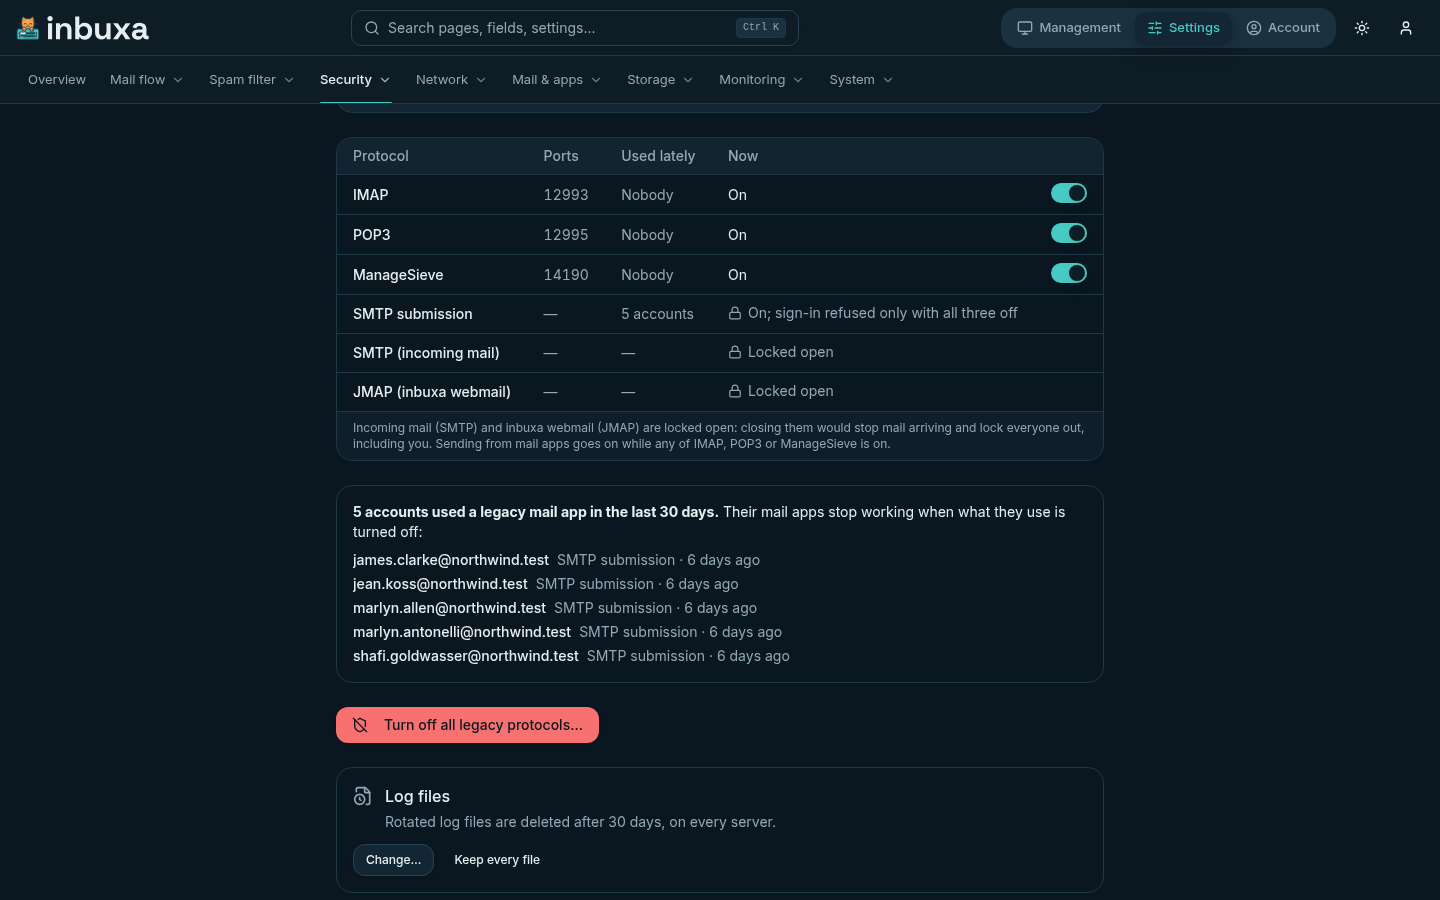
Log files record client IP addresses and email addresses, so they're personal data. Settings › Security › Security, Log files, sets how many days rotated files are kept; older ones are deleted, hourly, on every server in a cluster. Age counts from a file's last change, so the one being written is never old enough to go, and only the log's own files are touched.
| Server | Default |
|---|---|
| Installed with 2026.9.28.4 or later | 30 days |
| Installed before | Every file kept, as before, until you set a number |
Keep every file turns the limit off again. Changing it is recorded in the audit log and shows on the compliance Overview.
Tracers are set under Settings › Monitoring › Tracers: Log file, Console, Systemd Journal, and Open Telemetry over HTTP or gRPC. Each has its own Logging level and can be limited to the events you choose. Which level each kind of event is logged at is under Settings › Monitoring › Event levels.
Changes to a tracer apply without a restart, and no event is lost or written twice while it switches over.
Metrics for other tools
Every page under Settings › Monitoring › Metrics opens with Where the server's numbers go:
- Let Prometheus collect them. Prometheus fetches the numbers from
/metrics/prometheus. Give it a User name and Make a password: the page then shows the scrape job to paste into Prometheus, with the new password in it. The password is shown only then, so copy it before you leave. Check it answers tries the address from your browser. Without a user name anyone who can reach the server can read the numbers, which show how busy it is. - Send them to an OpenTelemetry service, once a minute: Honeycomb
(an ingest key and a dataset), Grafana Cloud (the OTLP endpoint,
instance ID and a token with
metrics:write), or your own collector over HTTP or gRPC. The server sends counters as deltas; if some don't show up, put an OpenTelemetry Collector with thedeltatocumulativeprocessor in between.
Which metrics are exported, and every other setting, is in the form under it.
Alerts
Settings › Monitoring › Alerts opens with the alerts you have, each as a sentence ("When more than 500 messages are waiting to be delivered, email [email protected]."), and templates for the ones most servers want:
- The queue is backing up: more than a number of messages waiting to be delivered, 500 unless you choose another.
- Memory is running high: the server using more than an amount of memory, 2048 MB unless you choose another.
- Certificate renewal failed.
- The data store reported an error.
- Publishing DNS records failed.
A template asks who to email, preferably an address not hosted on this server, and whether to also raise an event for webhooks. The list below shows each alert's condition in the same words.
Alerts are checked every minute, and email once when their condition turns true. The queue and memory alerts can fire again once things have recovered. The others count events since the server started, so they fire the first time and then not again until a restart: right for rare, serious events, and why no template watches a rate.
Any alert can also be written by hand, with its own Alert condition. Alerts need the metrics store.
Webhooks
Settings › Monitoring › Webhooks sends the server's events to your own systems as they happen, for paging or anything else. Each request is a POST with a JSON body holding one or more events, batched at most once per Throttle interval:
{
  "events": [
    {
      "id": "1790000000001234",
      "createdAt": "2026-09-28T19:15:24Z",
      "type": "auth.failed",
      "data": { "…": "the event's own details, which vary by event" }
    }
  ]
}
- Choosing events. The events are grouped by what they're about, with a search ("bounce", "ban", "certificate"). A new webhook starts with none, so it sends nothing until you pick them. One set to send everything except a list sends the events at or above its level, and never a protocol's raw input or output, which carries whole messages and passwords, unless you name those events yourself.
- Signature. With a Signature Key set, each request carries
X-Signature: the HMAC-SHA256 of the raw body under that key, in base64. Compute it on your side and compare before trusting the request. - Send test. A saved webhook's page has Send a test event. The
server sends one sample event of type
webhook.test, with anX-Inbuxa-Test: trueheader, using the saved settings, even while the webhook is switched off. It says what came back: delivered, with the answer and how long it took, or why not. Save changes first to test them. - Retries. Failed deliveries are retried until Discard after.
Reports from other servers
Other mail servers send reports about mail from your domains, and yours sends them reports in turn:
- Management › Reports › Inbox: DMARC, TLS and ARF (abuse) reports received.
- Management › Reports › Outbox: DMARC and TLS reports waiting to be sent.
A DMARC report is where you find mail using your domain that doesn't pass, which is the first thing to read before tightening a DMARC policy.
Every page under Settings › Mail flow › Reports opens with what goes out and what comes in, as switches:
- Tell other domains how mail claiming to be from them fared here (DMARC).
- Tell them whether their mail reached us encrypted (TLS).
- Report each message that fails their checks (DMARC, DKIM, SPF), at most once a day per address. These carry the failing message's headers, and with them people's addresses, which is why most large providers don't send them.
- Which of your domains they, and bounce messages, are sent from: for
example
noreply-dmarc@andMAILER-DAEMON@that domain. - Which addresses the reports others send you arrive at, to be shown under Management › Reports, and whether to deliver them to that mailbox as well.
Names, subjects and every other setting are in the form under it.
Health checks
/healthz/live and /healthz/ready are for load balancers and
orchestrators, and /healthz/cluster for monitoring a cluster's
coordinator. Ready answers 503 while the data store can't be reached; live
stays up. See Clustering for all three.